Longevity
Longevity Biomarkers to Track: A Scientific Framework for Biological Performance
By Samir Levin · September 6, 2026 · 17 min read
Disclaimer
This article is for informational and educational purposes only. It does not constitute medical advice, diagnosis, or treatment. Always consult a qualified healthcare provider before starting any new supplement, peptide, or protocol. Keys to Health and Samir Levin are not responsible for any actions taken based on this content.
"Normal" lab results are a statistical average of a sick population, not a blueprint for elite performance. If your physician claims your bloodwork is fine but your recovery is lagging and your cognitive clarity is fading, you're looking at the wrong data. Establishing a rigorous list of longevity biomarkers to track is the only way to move beyond the "absence of disease" and toward superior biological performance. Standard diagnostic panels are designed to catch pathology after it develops; they aren't built to monitor the subtle shifts in your physiological reserve.
It's frustrating to receive standard results that offer no actionable path forward. You deserve a framework that distinguishes between basic reference ranges and optimal performance zones. This article identifies the critical blood markers and physiological data points required to measure your true biological age. We'll examine the clinical importance of ApoB and Lp(a) for cardiovascular integrity, the role of fasting insulin in metabolic efficiency, and how to implement a longitudinal tracking system that actually informs your protocol. Stop guessing about your health and start measuring the metrics that dictate your lifespan.
Key Takeaways
- Differentiate between population-derived reference ranges and performance-based targets to identify biological decay before pathology develops.
- Prioritize Apolipoprotein B (ApoB) and fasting insulin as the foundational longevity biomarkers to track for cardiovascular and metabolic risk assessment.
- Evaluate systemic inflammation and methylation status using hs-CRP and Homocysteine to mitigate the primary drivers of cellular aging.
- Move beyond total hormone counts to measure bioactive markers like Free Testosterone and Free T3 for a precise understanding of metabolic reserve.
- Adopt a quarterly testing cadence and utilize AI-driven tools to detect subtle cross-marker correlations that define your biological trajectory.
Table of Contents
- The Clinical Limitations of Conventional Laboratory Reference Ranges
- Cardiovascular and Metabolic Foundations: The Primary Longevity Markers
- Inflammation and Glycation: Tracking the Drivers of Biological Decay
- Hormonal Health and Organ Reserve: Predictive Endocrine Markers
- Implementing a Scientific Tracking Strategy with AI Bloodwork Analysis
The Clinical Limitations of Conventional Laboratory Reference Ranges
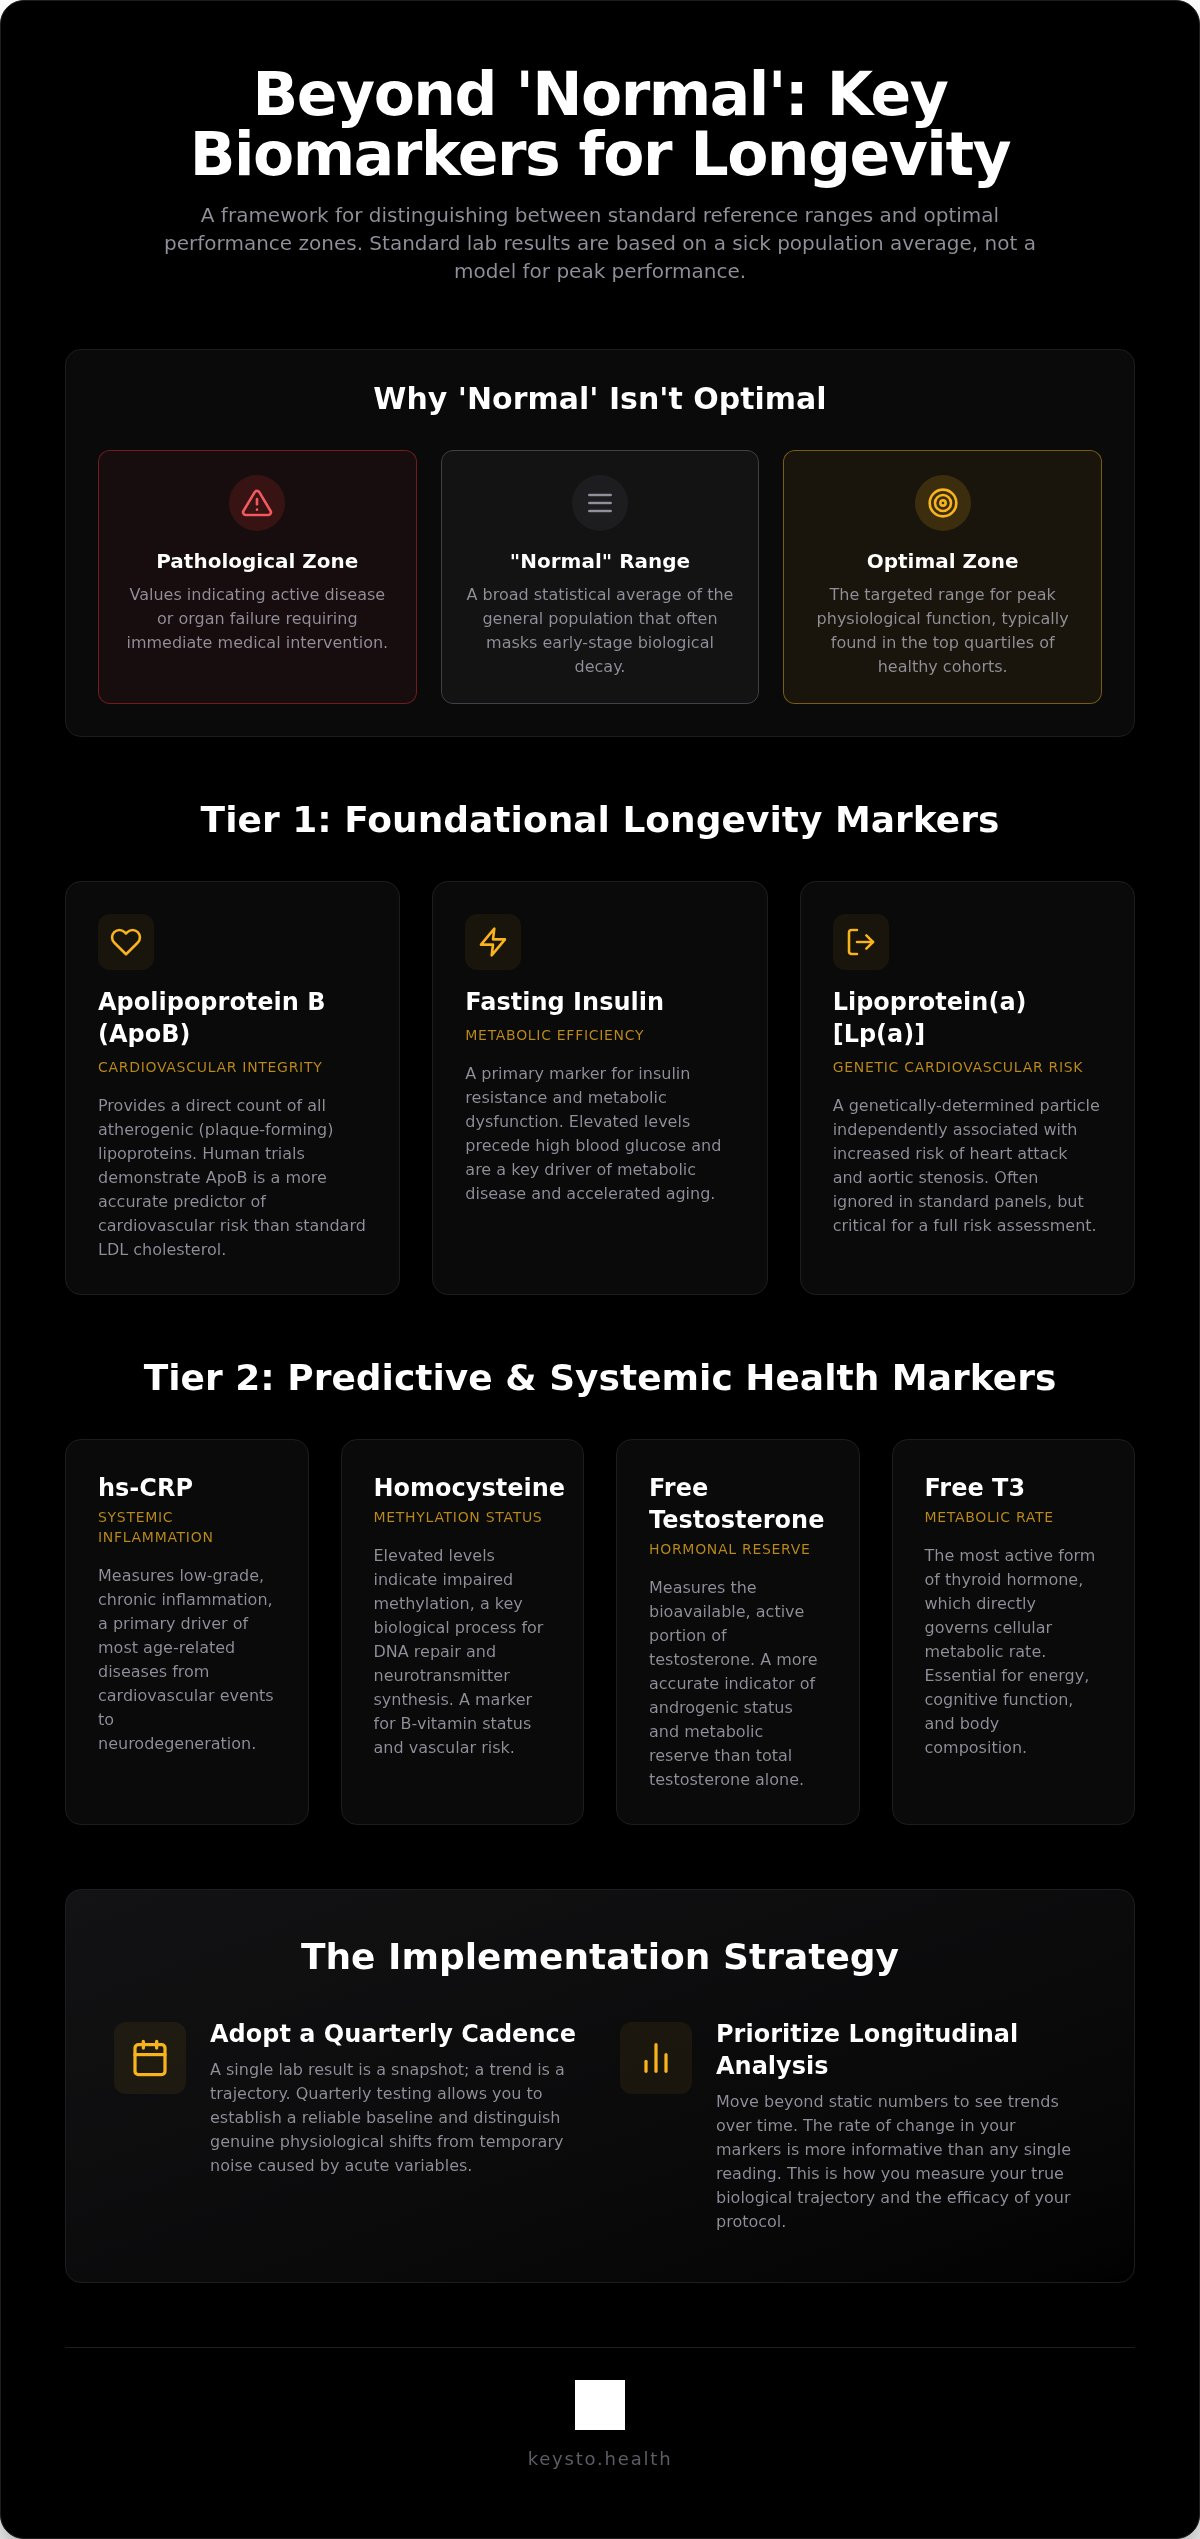
Standard medical diagnostics are built to identify pathology, not to optimize performance. When you review a blood panel, the provided reference ranges aren't targets for vitality. They're statistical boundaries derived from a bell curve of the general population. This demographic includes the sedentary, the metabolically compromised, and the elderly. Being "within range" simply means you're not currently manifesting an acute disease state. It doesn't mean your systems are functioning at peak capacity. To truly optimize your health, you need to understand which longevity biomarkers to track and how they relate to your specific physiological goals.
The Statistical Flaw in Population-Based Norms
Reference ranges typically encompass the middle 95% of the population tested at a specific lab. This mathematical model includes the bottom 2.5% and top 2.5% of individuals who may already be symptomatic. Over the last several decades, these "normal" ranges have shifted significantly. For example, "normal" testosterone levels have declined while "normal" fasting glucose levels have trended upward, reflecting a general decline in population health. Identifying specific Biomarkers of aging requires a shift from avoiding sickness to pursuing physiological excellence. You should categorize your results into three distinct zones:
- Pathological: Values indicating active disease or organ failure requiring immediate intervention.
- Normal: A broad statistical average that often masks early-stage biological decay.
- Optimal: The targeted range for peak physiological function, typically found in the top quartiles of healthy cohorts.
Defining Your Biological Baseline
A single lab result is merely a snapshot in time. It's susceptible to acute variables like sleep deprivation, recent overtraining, or nutritional intake. This is why establishing a list of longevity biomarkers to track requires a commitment to longitudinal data collection. Quarterly testing is the standard for serious biohackers. It allows you to distinguish between an outlier caused by temporary stress and a genuine upward slope in markers like hs-CRP or HbA1c over a 12-month period.
Using tools like the HRT Bloodwork Analyzer helps you move beyond static numbers to see how your data correlates with your specific performance protocols. A single high reading is often less concerning than a consistent, trending upward slope in inflammatory or metabolic markers. You aren't just looking for a pass/fail grade; you're looking for the rate of change in your physiological reserve. Consistency in testing conditions is paramount to ensure you're measuring the trend rather than the noise.
Cardiovascular and Metabolic Foundations: The Primary Longevity Markers
Cardiovascular disease remains the primary driver of all-cause mortality. Relying on a standard lipid panel is a strategic error. While most clinicians focus on LDL-C, this metric only measures the mass of cholesterol within particles. It doesn't account for particle concentration. Apolipoprotein B (ApoB) has been shown to be a more accurate predictor of cardiovascular risk because it provides a direct count of all atherogenic lipoproteins. Every particle containing an ApoB molecule has the potential to penetrate the arterial wall and initiate plaque formation. High-performance Vascular Health Biohacking focuses on aggressive ApoB suppression to preserve the endothelial glycocalyx and prevent structural decay.
ApoB and the Endothelial Glycocalyx
Lowering ApoB early in the lifespan appears to provide cumulative protection against atherosclerotic events. Human trials demonstrate that individuals with genetically lower ApoB levels throughout life have a significantly reduced risk of heart disease, regardless of other lifestyle factors. You must also track Lipoprotein(a), or Lp(a). This is a genetically determined particle that standard panels frequently ignore. The 2026 ACC/AHA guidelines now recommend all adults measure Lp(a) at least once to assess cardiovascular risk. High levels are independently associated with increased risk of myocardial infarction and aortic stenosis. Endothelial health serves as a primary proxy for systemic biological age. When the lining of your vasculature fails, systemic organ decline follows.
Metabolic Efficiency: Insulin and Glucose
Metabolic dysfunction is often invisible on standard bloodwork until it's well advanced. HbA1c provides a three-month average of blood glucose, but it's a lagging indicator. Fasting insulin is the superior early warning sign. It often fluctuates years before HbA1c or fasting glucose levels elevate. In high-performance contexts, optimal fasting insulin ranges are typically below 5 uIU/mL. Levels above this suggest early-stage insulin resistance and a loss of metabolic flexibility. The Validation of biomarkers of aging requires rigorous metabolic scrutiny to ensure you aren't simply "pre-diabetic" by a different name. Utilizing a structured Metabolic Health Protocol allows for precise management of glycemic variability and insulin sensitivity. If you're serious about performance, you need precision longevity protocols that address these foundational pillars before they become clinical liabilities.
Inflammation and Glycation: Tracking the Drivers of Biological Decay
Chronic low-grade inflammation, often termed "inflammaging," is a primary driver of biological decay. It accelerates cellular senescence, where cells stop dividing but remain metabolically active, secreting pro-inflammatory cytokines that damage neighboring tissues. This systemic leakage of inflammatory signals degrades organ reserve over time. To quantify this decay, you must identify specific longevity biomarkers to track that reflect both inflammatory load and metabolic byproducts. These markers act as an early warning system for systemic structural failure.
Hs-CRP and Systemic Inflammatory Load
High-Sensitivity C-Reactive Protein (hs-CRP) is a staple in any list of longevity biomarkers to track. It's a non-specific marker; an elevation could stem from an acute injury, chronic gut dysbiosis, or silent infections. For longevity optimization, the goal isn't just to be "within range" (typically below 3.0 mg/L), but to maintain levels below 1.0 mg/L. Persistent elevation suggests a systemic inflammatory load that requires intervention. Implementing the Immune Protocol helps modulate these inflammatory pathways through research-backed nutritional and lifestyle adjustments. If your hs-CRP remains high despite a clean lifestyle, you're likely dealing with a hidden source of systemic stress.
Methylation and Homocysteine
Homocysteine is a critical indicator of methylation efficiency. Methylation is a fundamental biochemical process involved in DNA repair and neurotransmitter production. Evidence suggests that homocysteine levels exceeding 10 umol/L are associated with an increased risk of cognitive decline and neurological dysfunction. High homocysteine also appears to impair Vascular Aging Prevention by damaging the endothelial lining. Optimization typically involves targeted use of B-vitamins and trimethylglycine (TMG) to restore methylation balance. You can't achieve superior cognitive performance if your methylation cycle is compromised.
Uric Acid and Metabolic Dysfunction
Uric acid is often overlooked in standard longevity panels. While it acts as an antioxidant in the extracellular space, excessive levels function as a pro-oxidant inside the cell. This drives mitochondrial stress and metabolic dysfunction. Elevated uric acid is frequently a byproduct of high fructose intake or excessive alcohol consumption. The American Federation for Aging Research (AFAR) provides essential criteria for aging biomarkers, noting that valid markers must reflect the underlying biological process of aging rather than just the presence of disease. Tracking uric acid alongside hs-CRP and homocysteine provides a clear picture of the chemical environment driving your biological age. Don't ignore these markers just because they aren't part of a standard annual physical.
Hormonal Health and Organ Reserve: Predictive Endocrine Markers
Hormonal signaling dictates the rate of cellular repair and metabolic output. As you age, your endocrine system's ability to maintain homeostasis diminishes, leading to a loss of organ reserve. Total hormone levels are often misleading vanity metrics that fail to reflect actual biological activity. Identifying the correct hormonal longevity biomarkers to track requires a shift toward measuring bioactive fractions and the ratios between signaling molecules. This approach provides a clearer picture of your physiological resilience and your body's capacity for regeneration.
Androgen Optimization for Longevity
Total testosterone is an incomplete metric because it doesn't account for the amount of hormone actually available to your tissues. You must track Free Testosterone and Sex Hormone Binding Globulin (SHBG). SHBG acts as a carrier protein; high levels can bind up your testosterone, leaving you functionally deficient despite a high total number. Conversely, excessively low SHBG is often an early indicator of metabolic dysfunction or fatty liver. Maintaining tissue sensitivity is the goal of a structured Testosterone Optimization Protocol. This ensures that your androgens are supporting lean mass preservation and cognitive function without driving supraphysiological pathology.
The thyroid panel is another area where standard diagnostics fail. Most clinicians only measure Thyroid Stimulating Hormone (TSH), which is a pituitary signal, not a direct measure of metabolic activity. A comprehensive list of longevity biomarkers to track must include Free T3, Free T4, and Reverse T3. Free T3 is the active hormone that drives mitochondrial function. If your Reverse T3 is elevated, it can block T3 receptors, leading to "hypothyroid" symptoms despite a normal TSH. This state of cellular hypothyroidism is a significant hurdle for those pursuing elite biological performance.
Renal and Hepatic Function
Standard kidney health markers like creatinine are heavily influenced by skeletal muscle mass and dietary protein intake. For athletes and biohackers, Cystatin C is a superior marker for assessing the glomerular filtration rate (GFR). It's produced at a constant rate by all nucleated cells and isn't skewed by muscle volume, providing a more precise assessment of renal integrity. In the liver, Gamma-Glutamyl Transferase (GGT) serves as a potent predictive marker for all-cause mortality. While it's often used to screen for alcohol abuse, even "high-normal" GGT levels are associated with increased oxidative stress and metabolic syndrome. Utilizing the Prevention Protocol helps maintain these organ reserves through targeted micronutrient support and lifestyle management.
Insulin-like Growth Factor 1 (IGF-1) represents a complex, U-shaped relationship with longevity. Low IGF-1 is associated with frailty, muscle wasting, and immunosenescence. However, chronically high IGF-1 can accelerate cellular aging and increase the risk of certain cancers by over-activating growth pathways. The objective is to find the "Goldilocks" zone that supports tissue repair and muscle mass without driving excessive cellular proliferation. Balancing these endocrine markers is essential for anyone serious about extending their healthspan.
Implementing a Scientific Tracking Strategy with AI Bloodwork Analysis
Data collection is only the initial phase of biological optimization. The primary failure in traditional medicine is the reliance on manual, subjective interpretation of disparate lab results. Human cognition isn't equipped to detect subtle, multi-marker correlations across years of longitudinal data. To effectively utilize a list of longevity biomarkers to track, you must employ algorithmic pattern recognition. This transition from reactive diagnostics to predictive modeling is what separates basic health maintenance from elite performance architecture.
Leveraging the AI Bloodwork Analyzer
Standard laboratory reports provide a binary pass/fail grade based on population averages. The AI Bloodwork Analyzer identifies patterns that standard reviews ignore, such as the complex interplay between SHBG, fasting insulin, and hepatic enzymes. Algorithmic analysis can flag early-stage metabolic drift long before it reaches pathological thresholds. This allows for preemptive protocol adjustments that preserve organ reserve. For a detailed breakdown of the technical implementation, you can explore the research-backed insights available in our biohacking knowledge base.
Quarterly Review and Protocol Adjustment
A quarterly testing frequency is the minimum requirement for balancing data density with practical implementation. This three-month cadence allows you to validate the efficacy of a specific intervention, whether it's a change in compound dosage or a shift in metabolic strategy. The "test, adjust, re-test" cycle is the only scientifically defensible way to manage your biological capital. Biomarker velocity is the rate of change in a specific marker over time, which is more predictive of future health outcomes than any single absolute value.
Responding to these shifts requires a dynamic framework like the Longevity Protocol. Once you've identified the necessary longevity biomarkers to track and established your personal velocity, the final step is moving from data to action. The AI Protocol Builder bridges this gap by generating precise, research-backed interventions based on your unique biological signature. Optimization isn't a destination; it's a continuous loop of data-driven refinement and execution.
Transitioning from Data Collection to Biological Execution
Standard laboratory results are often a distraction from true health optimization. Relying on population-based averages ensures you remain within a statistical norm of decline rather than a zone of performance. True longevity requires monitoring the velocity of critical metrics like ApoB, fasting insulin, and hs-CRP. Establishing a definitive list of longevity biomarkers to track is the foundational step in shifting from reactive diagnostics to proactive, data-driven management of your physiological reserve.
Algorithmic analysis provides a level of accuracy that manual review cannot match. By utilizing AI-driven pattern recognition and expert human optimization protocols, you can identify subtle shifts in your biological trajectory before they manifest as pathology. Stop viewing your bloodwork as a static snapshot and start using it as a dynamic framework for systemic preservation. Your healthspan is a variable you can influence through rigorous tracking and scientific research tools.
Commit to a longitudinal strategy that prioritizes data density and protocol refinement. The tools for superior biological performance are available; the only remaining requirement is your commitment to the data.
Frequently Asked Questions
What are the most important longevity biomarkers to track for beginners?
Beginners should prioritize Apolipoprotein B (ApoB), fasting insulin, and high-sensitivity C-reactive protein (hs-CRP). These metrics provide a high-level overview of cardiovascular risk, metabolic efficiency, and systemic inflammation. While these are the foundational longevity biomarkers to track, they must be interpreted within the context of your specific performance goals. Establishing these baselines early allows you to detect subtle physiological shifts before they manifest as chronic disease or performance plateaus.
How often should I get bloodwork done for longevity tracking?
A quarterly testing frequency is the standard for serious biological tracking. Getting bloodwork done every 90 days provides enough data density to identify personal trends while allowing time for lifestyle or protocol adjustments to manifest in the results. Annual or bi-annual testing is insufficient for catching the biomarker velocity required to optimize performance. Frequent data collection ensures that your interventions are based on current physiological states rather than outdated snapshots.
Is ApoB a better marker for heart health than LDL cholesterol?
Human trials demonstrate that ApoB is a superior predictor of cardiovascular risk compared to LDL cholesterol. While LDL-C measures the total mass of cholesterol, ApoB provides a direct count of the actual particles capable of driving atherosclerosis. Every particle containing an ApoB molecule is potentially atherogenic. Measuring the concentration of these particles allows for a more precise assessment of arterial health and the efficacy of lipid-lowering protocols.
Can biological age optimization be measured through standard blood tests?
Standard blood tests contain significant data for biological age optimization if analyzed correctly. Algorithms like PhenoAge use common markers including albumin, creatinine, glucose, and C-reactive protein to estimate biological status. While these tests are routine, the value lies in moving beyond "normal" ranges to identify the optimal zones associated with lower mortality. Using specialized tools helps extract these predictive insights from standard metabolic and lipid panels when identifying which longevity biomarkers to track.
What is the difference between chronological age and biological age?
Chronological age is simply the number of years you've been alive. Biological age reflects the functional status of your organ systems and cellular integrity. Two individuals of the same chronological age can have vastly different biological ages based on metabolic health, inflammatory load, and hormonal reserve. Biological age is a malleable metric that can be influenced by targeted protocols. Chronological age is an immutable constant that lacks predictive utility for individual performance.
Why is fasting insulin more important than HbA1c for early detection?
Fasting insulin is a leading indicator of metabolic dysfunction that often rises years before HbA1c reflects any abnormality. HbA1c is a lagging indicator; it only measures average blood glucose over the preceding three months. By the time HbA1c is elevated, insulin resistance is already well established. Tracking fasting insulin allows you to identify early-stage glycemic drift and intervene while metabolic flexibility is still relatively high, preventing long-term cellular damage.
How does the AI Bloodwork Analyzer improve on standard lab reports?
The AI Bloodwork Analyzer identifies subtle cross-marker correlations that are frequently missed during manual human review. Standard reports use broad statistical averages to determine normalcy, whereas algorithmic analysis focuses on identifying the optimal zone for performance. By analyzing the interplay between markers like SHBG, liver enzymes, and lipids, the tool provides a predictive model of your health trajectory. This enables more precise protocol adjustments based on objective data patterns.
Does high IGF-1 increase the risk of cancer in longevity models?
High IGF-1 represents a complex, U-shaped risk profile in longevity science. While adequate levels are necessary for tissue repair and muscle preservation, chronically high IGF-1 has been shown to increase the risk of certain cancers in human observational studies. This is likely due to the over-activation of cellular growth and proliferation pathways. The goal is to maintain IGF-1 in a range that supports recovery without driving excessive mitogenic activity.

Article by
Samir Levin
Samir Levin is a biohacker and longevity researcher with 25 years of personal experimentation across peptides, hormonal optimization, and regenerative medicine. He is the founder of Keys to Health — a platform combining a 112-compound research encyclopedia, AI-powered bloodwork analyzer, peptide protocol builder, and evidence-based PDF protocols used by thousands of biohackers worldwide.
Samir's work is grounded in first-person experimentation, not theory. He personally reversed 10+ years of AAS-induced gynecomastia without surgery using an enzymatic stack he developed and documented. His protocols are built from clinical literature, N=1 data, and feedback from the Keys to Health community.
He covers peptides, TRT/HRT, GLP-1 agents, senolytics, longevity stacks, cognitive enhancement, and animal longevity protocols for dogs, cats, and horses.
LongevityBiohackingBlood TestingBiological AgePerformanceApoBFasting InsulinMetabolic Health